A Dive Into How Predictive Policing Works and its Effectiveness
Overview
As many cities move toward using machine learning in their policing systems, we want to explore how these systems affect the people being policed. Several cities have implemented the use of predictive policing algorithms including New York City NY and Santa Cruz CA. The models built for ‘predictive policing’ claim to have reduced crime and increased efficiency in police resources. These claims have led us to investigate the question: “How is predictive policing being used and what is the effect on traffic stops?”.
Our goal is to see if there is a causal effect of reducing crime, and assess possible model bias in PredPol. We will look at data from the LAPD, and although the results cannot necessarily generalize, the structure of the predictive policing algorithms being used is similar: optimizing police resources to deter crime before it happens.
The LAPD began deploying PredPol in three divisions (Foothill, Southeast, North Hollywood) back in 2013. It was then extended to all 21 divisions in 2015 as shown in the map below.
We will proceed by looking at how trends in traffic/pedestrian stops, crimes, and arrests have changed since PredPol was deployed.
How have crimes and arrests changed?
If PredPol’s claims are true, we should be able to see a reduction in crime numbers once it was deployed. However, the animation below tells a different story. Although a few divisions did see a drop in crime numbers starting in 2013, most divisions saw an increase in 2015 when PredPol was deployed in all of them.
 On the other hand, arrest numbers in all divisions except for Hollywood and Central saw gradual decreases according to the animated map below. Our guess was that perhaps not all types of crimes were affected the same by PredPol. For example, increasing police presence in an area might discourage people to commit crimes that can be easily spotted in public. However, crimes that are more subtle such as computer hacking and fraud would not be affected as much. Thus, we then looked at how the distribution of crime types changed after PredPol was deployed.
The interactive maps below show the statistics from testing how the proportions of each crime type changed in each division after PredPol was deployed. The first map displays the proportion of crimes committed while the second one shows the proportion of arrests being made for the selected crime type. For the tests, our null hypothesis was that the proportions are the same regardless of PredPol’s deployment. At a significance level of 0.05, we reject the null hypothesis if the p-value falls under 0.05 and say that the proportion was either higher or lower depending on the sign of the statistic. By going through the different crime types, we can see that PredPol did not affect all crimes equally. Specfically, there was an overall increase in the proportions of property crimes being committed and arrested. On the other hand, financial crimes and other miscellaneous crimes saw decreases in both fields.
Was there a reduction in pedestrian and vehicle stops?
Since police stops is the most common form of interaction with a police, we also looked at how PredPol may have had an impact on pedestrian and vehicle stops. We wanted to see if the annual number of stops decreased after PredPol was deployed at both the county and division level. Although the county level analysis tells us that there was a decrease, not all divisions saw the same effect as shown in the plot below. For example, stops in the Hollenbeck division kept on increasing since 2016.
Did PredPol target minority groups?
The stops data also allowed us to see if there were any racial discrepancies in the stops made during PredPol’s deployment compared to before it was deployed.
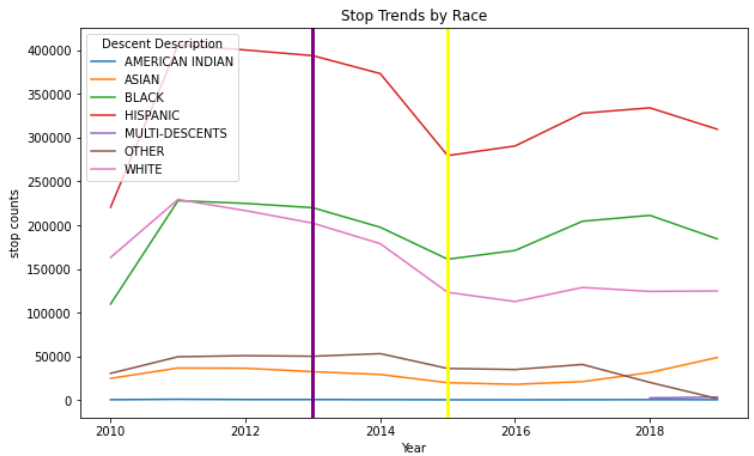
The plot above shows the annual number of stops made per race from 2010 to 2019. We see that all races went down during the period when PredPol was first rolled out to just three divisions. However, most of them started to increase once it was extended to all divisions in 2015. In our analysis, we took into account how different races have different population sizes by looking at the rates instead with the use of census data from 2010. Our results actually indicated that Black drivers and pedestrians had a higher rate of getting stopped in 2013 to 2014 in divisions that had PredPol deployed.
Conclusion
From the provided visuals and numbers above, we can already see that there were shifts in crime trends as well as stop trends ever since the LAPD began to deployed PredPol. The most obvious observation is that crimes in general did not go down which contradicts PredPol’s claim. However, due to a few caveats of our experimental setup and confounders, we are only able to draw a causal relationship between PredPol and crimes up to an extent. Here is the link to our study for a more detailed approach and findings.